PostgreSQL’s default settings are typically enough to make sure many environments run efficiently. Yet a production database, especially in need of higher performance, demands more than the default configuration can provide.
When used in production, PostgreSQL needs performance tuning to eliminate bottlenecks using configuration parameters, schema design, and query writing.
However, its configuration is not adequate for a high-performance production database. Production requires PostgreSQL performance optimization to address specific performance bottlenecks by adjusting configuration parameters, optimizing schema design, and rewriting queries.
This article covers each major area in detail, with tips and references, whether you’re just discovering PostgreSQL or are an experienced user. We’ll explain how to analyze query plans, use indexes wisely, tune configuration settings, select hardware, and employ monitoring tools. We also cover best practices for schema design and keeping tables healthy with vacuuming.
What is PostgreSQL performance optimization?
PostgreSQL performance tuning is a set of activities to optimize and maximize database speed in a production environment by adjusting or tuning configuration parameters, improving schema design, and writing queries to achieve maximum performance.
Best Practices for Postgres Performance
Optimizing PostgreSQL performance requires a multi-layered approach that addresses indexing strategy, query optimization, and database configuration.
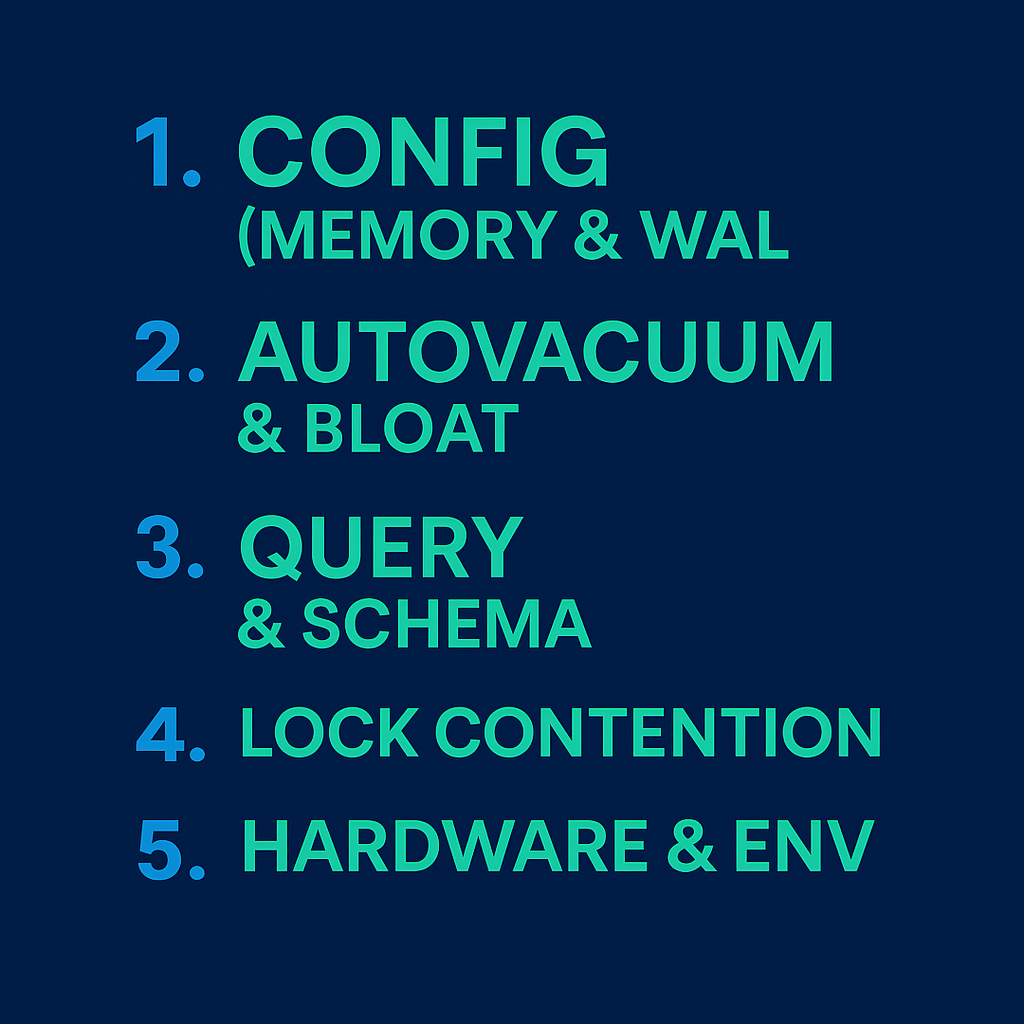
Start with:
1. Configuration Parameter Tuning (Memory and WAL)
Many key configuration parameters can be adjusted in the postgresql.conf file, although changes typically require a server restart to take effect.
Memory Configuration
Memory tuning is crucial because insufficient memory can lead to expensive disk I/O operations, slow query performance, or even out-of-memory exceptions.
| Parameter | Purpose & Default Value | Recommendations & Key Insights |
| shared_buffers | Sets memory for shared buffers used by backend processes. The default set is typically 32 or 128MB. | The recommended range is 25% of the total system RAM, or about 75% of dedicated database memory up to about 2GB. Setting this too high (over 40% of RAM) can starve the OS of memory, causing detrimental swapping. |
| work_mem | Maximum memory allowed for a query operation (sort, hash) before writing data to temporary disk files. Default is 1MB or 4MB. | Set higher (e.g., 32MB) to keep operations in memory and prevent slow disk writes for tasks like ORDER BY and joins. This limit is applied per operation, so total memory usage can be many times this value in concurrent workloads. |
| maintenance_work_mem | Maximum memory for maintenance tasks (VACUUM, CREATE INDEX, ALTER TABLE ADD FOREIGN KEY). Default is 16MB or 64MB. | Should be set higher than work_mem (e.g., 128MB or 5% of Total RAM) to substantially speed up maintenance activities, as only one such operation usually runs per session. |
| effective_cache_size | An estimate informing the query planner of the total memory available for caching (including OS cache). Default is typically 4GB. | Set high (e.g., 50% of total RAM) to encourage the planner to use index scans rather than sequential scans. The database does not directly use this memory. |
Write-Ahead Log (WAL) and Checkpointing
WAL ensures data integrity and crash recovery. Checkpoints flush dirty data pages from memory to disk, which creates a significant I/O load.
To tune WAL, wal_buffers should be increased (recommended 1MB vs. the default 64kB) for better performance, especially with large geospatial data.
The frequency of checkpoints can be managed by adjusting checkpoint_timeout (default 5 minutes) to a higher value (e.g., 15 or 30 minutes) to reduce I/O spikes. Don’t forget to adjust max_wal_size/min_wal_size as well.
The parameter checkpoint_completion_target can be tuned to spread the I/O load caused by checkpoints over a longer period.
Query Cost Estimation
The query planner uses cost parameters to decide between executions. random_page_cost is the cost of non-sequential disk page access; the default is 4.0. Reduce it to 2.0 for spinning media (or 1.0 for SSDs) to make the planner prefer index scans.
2. Maintenance Tuning (Autovacuum and Bloat)
Performance degradation often stems from bloat, which is the accumulation of dead rows (or tuples) left behind by UPDATE and DELETE operations. Bloat increases disk usage and forces queries to scan unnecessary data. The VACUUM command reclaims this space.
Autovacuum Tuning
The automated background process, Autovacuum, is crucial for timely cleanup and analysis. Disabling it can lead to severe performance issues.
The goal of autovacuum tuning is to trigger cleanup more frequently with smaller batches of dead rows, minimizing disruption to user queries.
| Tuning Area | Configuration Parameter(s) | Optimization Strategy |
| Trigger Frequency | autovacuum_vacuum_threshold and autovacuum_vacuum_scale_factor | Decrease the scale factor (e.g., from default 0.2 to 0.01) so cleanup is triggered sooner, especially for large tables (where 20% bloat might equal wasting 200GB). |
| Resource Throttling | autovacuum_vacuum_cost_limit (default 200) and autovacuum_vacuum_cost_delay (default 2ms in PG 12+). | Increase the cost limit (e.g., to 1000–2000) or lower the delay, particularly on older releases (pre-PG 14) or modern hardware, to increase cleanup throughput. |
| Concurrency | autovacuum_max_workers (default 3). | Increasing the number of workers alone does not increase overall cleanup throughput, as the cost limit is shared globally; it only makes individual workers slower. Don’t forget to tune the cost/delay accordingly. |
3. Query and Schema Design Optimization
Optimization heavily relies on schema structure, indexing, and understanding how PostgreSQL executes queries.
Query Analysis using EXPLAIN and ANALYZE
The EXPLAIN statement reveals the query plan (estimated costs and execution steps). EXPLAIN ANALYZE executes the query and provides the actual runtime statistics, which are indispensable for identifying bottlenecks.
Stale database statistics can cause the query planner to choose inefficient plans. Regularly running ANALYZE updates these statistics.
When a bottleneck is found, setting engine parameters (like enable_seqscan to off) for a single session can help manually test optimization hypotheses.
Indexing Strategy
Indexing is fundamental, speeding up lookups, improving query planning, and minimizing disk I/O.
Create indexes on columns frequently used in WHERE, JOIN, and ORDER BY clauses.
Utilize specific index types for advanced needs, such as GIN (preferred for text search and array operations), GiST (complex data types, though potentially lossy), BRIN (for large, sorted data), and Partial Indexes (on a subset of data).
Finally, indexes require maintenance overhead during writes and consume storage. Over-indexing is counter-productive. Use tools like pg_stat_user_indexes to audit and remove unused indexes. Rebuilding bloated indexes (REINDEX) improves lookup performance when done periodically.
Partitioning
Partitioning divides large tables into smaller, manageable partitions, primarily improving query performance, index size, and maintenance.
Consider partitioning for tables exceeding 100GB, handling high ingestion rates, or experiencing performance degradation on queries that touch only a subset of data.
To gain performance benefits, queries must use the partition key in the WHERE clause, allowing PostgreSQL to access only the relevant partitions. In tests, effective partition pruning reduced lock overhead and improved performance by 34 percent (46,000 tps to 59,000 tps) under high concurrency, according to Amazon.
If queries frequently perform full scans and don’t use the partition key, partitioning can degrade performance due to the overhead of scanning every partition.
Query Rewriting
Query modification can force the use of indexes or improve efficiency:
Ensure that columns used in joins have matching collations and data types (including length definitions). Otherwise, the planner might resort to slower sequential scans rather than using available indexes, resulting in performance loss.
A sequential scan can occur if a VOLATILE function is called directly in a WHERE clause. Wrapping the function call in a subquery (WHERE field = (SELECT function())) allows index scans to be used.
For complex subqueries, replacing NOT IN with a correlated subquery using NOT EXISTS can enable index scans and significantly reduce execution time.
Common Table Expressions (CTEs) help break down complex logic and materialize intermediate results in memory if called repeatedly within the query, improving maintainability and performance. Warning: Use CTE for clarity. For PostgreSQL performance, test them first, because the planner can perform a sequential scan.
4. Lock Contention Management
In highly concurrent environments, performance bottlenecks can arise from Lightweight Lock (LWLock) contention. PostgreSQL uses a performance-optimized fast path locking mechanism for weak locks (like AccessShareLock). Each backend process is limited to 16 fast path slots.
Exceeding 16 slots forces the database to acquire locks via the slower shared memory lock table, causing LWLock:LockManager wait events. The exhaustion is triggered by queries that access many partitioned tables (without proper pruning) or tables with a large number of indexes, as each partition and index requires a lock.
Mitigation strategies must keep the lock footprint small, primarily through effective partition pruning and rigorous index hygiene (removing unnecessary indexes). If you can’t do otherwise, increase max_locks_per_transaction, as long as you are aware that it requires careful memory monitoring. Sometimes the problem is the client opening long transactions.
5. Hardware and Environment Tuning
Performance tuning requires optimizing the underlying infrastructure and resource management. Sometimes, you need to scale up your infrastructure, rather than out.
Use SSDs for improved read/write times. Separate high-throughput data like WAL files, data files, and indexes onto separate physical disks to reduce I/O contention.
Modern multi-core CPUs enable PostgreSQL features like parallel query execution. Don’t forget that excessive client connections exhaust system resources. Use a connection pooler like PgBouncer to manage and reuse connections efficiently. Tune max_connections based on system capacity to prevent resource exhaustion.
Other PostgreSQL Performance Techniques
Prepared Statements
Use prepared statements; they allow you to generate queries once and reuse them with different inputs, reducing the need for PostgreSQL to analyze and plan the query each time it is executed. However, just be aware that they only last for the duration of the database session and need to be recreated if the session is terminated.
Read Replicas
The most effective strategy to mitigate resource contention in mixed workloads is workload separation. Split two or more replicas of your database. At least one database replica works on writing new data, while others are for reading and consulting, spinning up more read replicas as necessary. Only do it if you really need more performance, as it adds costs and complexity to the project
Conclusion
PostgreSQL performance optimization is like tuning a sports car; when you boost one component (like increasing memory buffers), you need to fine-tune others (like write-ahead logging) to keep everything running smoothly and efficiently.
Getting these settings right requires deep expertise and experience. One wrong configuration can slow down your entire application or cause system instability.
Don’t let database performance hold your business back. Get the best talent to join your team
We can help you hire PostgreSQL experts who know exactly how to optimize your database for maximum speed, reliability, and cost-efficiency. They’ve tuned databases handling millions of queries daily and can diagnose performance bottlenecks in minutes, not days.